The Adirondack Park is a 6 million acre publicly protected area located in the most Northern section of New York State. Protected by the constitution of New York State in 1892, it is a “forever wild” forest preserve that is made up of over 3,000 lakes, 30,000 miles of rivers and streams, and a wide variety of habitats, including globally unique wetland types and old growth forests. The Adirondack Park is unique in its intricate mixture of public and private lands.
“Today the Park is the largest publicly protected area in the contiguous United States, greater in size than Yellowstone, Everglades, Glacier, and Grand Canyon National Park combined (Adirondack Park Agency).”
There are approximately 1,300 farms in the Adirondack Park, which accounts for 6% of the total market share for agricultural products in New York State. There are 57,600 acres of farmland in Essex County, the primary agricultural area in the Adirondack Park, but there has been a downward trend in working land and a 75 percent decrease in farmland since World War II. (Adirondack Harvest | Cornell Cooperative Extension of Essex County).
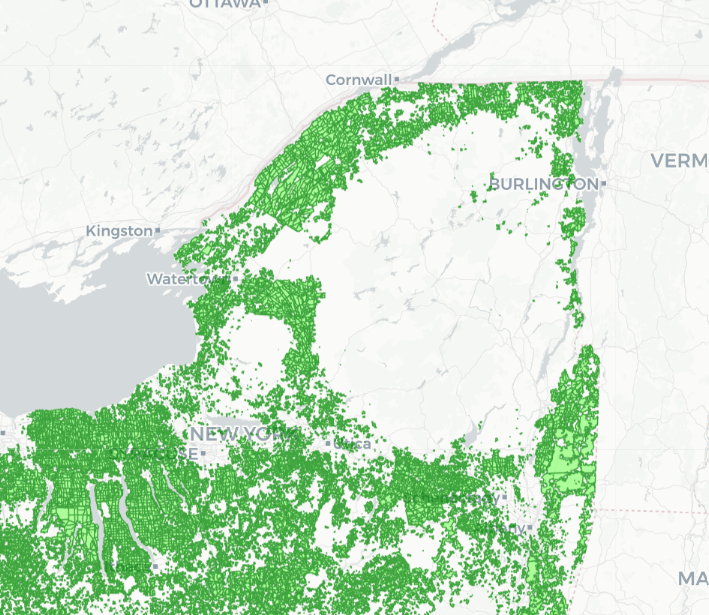
The park boundary lines are also a part of 12 different counties: Clinton, Franklin, Fulton, Hamilton, Herkimer, Lewis, Oneida, Saratoga, St. Lawrence, Warren, and Washington.
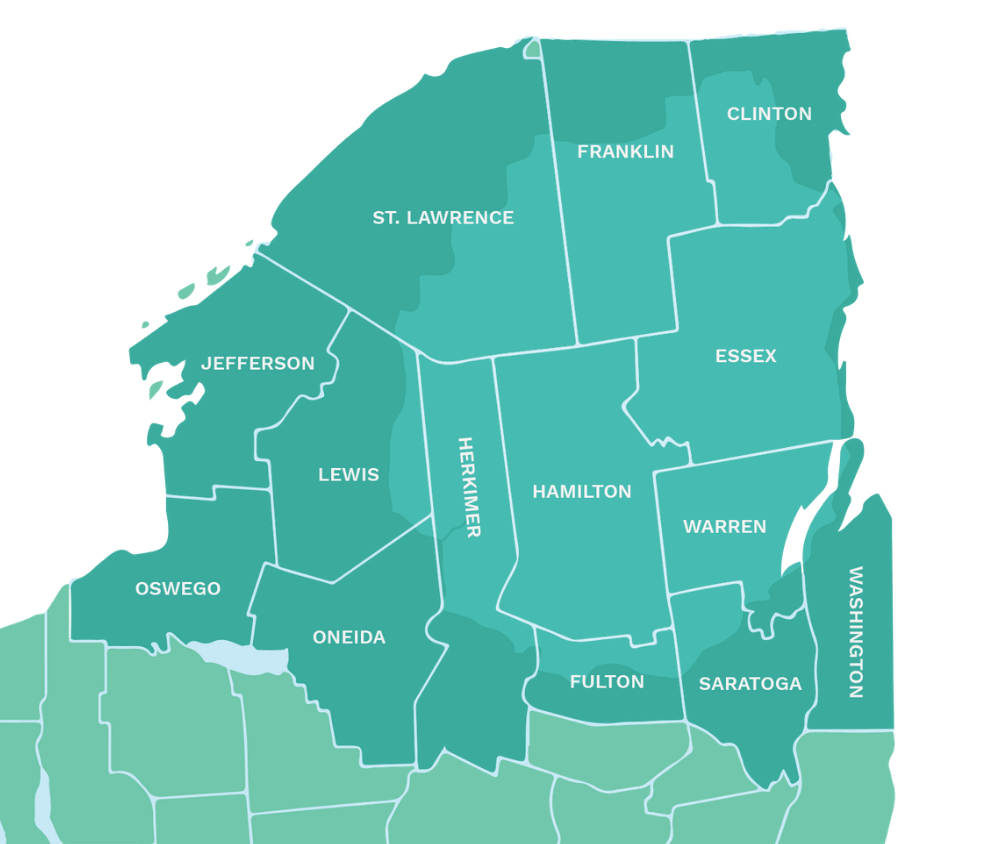
As you can see, there are counties that are part of the Adirondack Park, but are not completely within the boundary lines. A lot of my data is based on counties, and not on particular towns or regions within that county, so this will skew how we perceive food access or household income within the Park itself.
Economic data
Economic data for this kind of study is imperative in understanding what kind of resources are available to farms and the people that manage and run them.
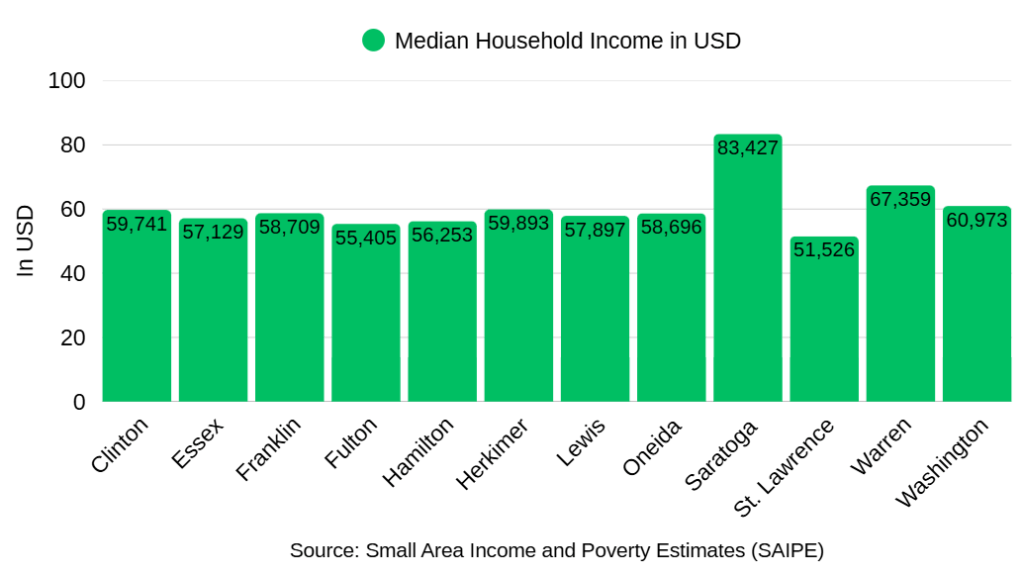
Median Household Income
The above below shows the Median Household Income in USD, and is from the Small Area Income and Poverty Estimates (SAIPE) and is part of the US Census Bureau. Being that many of the median income levels are between $50,000 and $61,000, that puts the Median Household Incomes for each of these counties above the Federal Poverty Rate, which is at $30,000 for an individual.
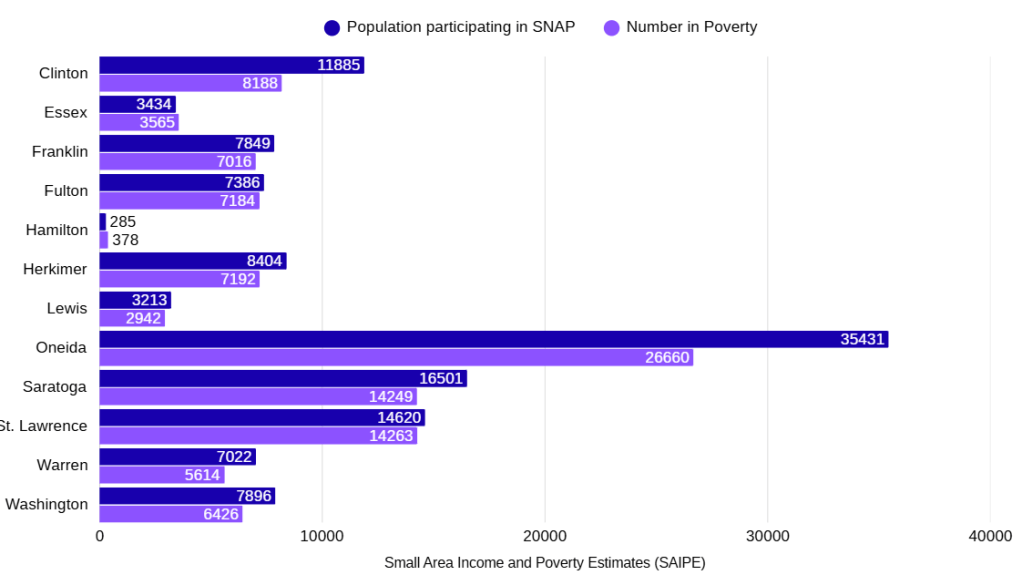
Poverty Levels and SNAP Benefits
What are SNAP Benefits? “The Supplemental Nutrition Assistance Program (SNAP) issues electronic benefits that can be used like cash to purchase food.
SNAP helps low-income working people, senior citizens, the disabled and others feed their families. Eligibility and benefit levels are based on household size, income and other factors” (Office of Temporary and Disability Assistance).
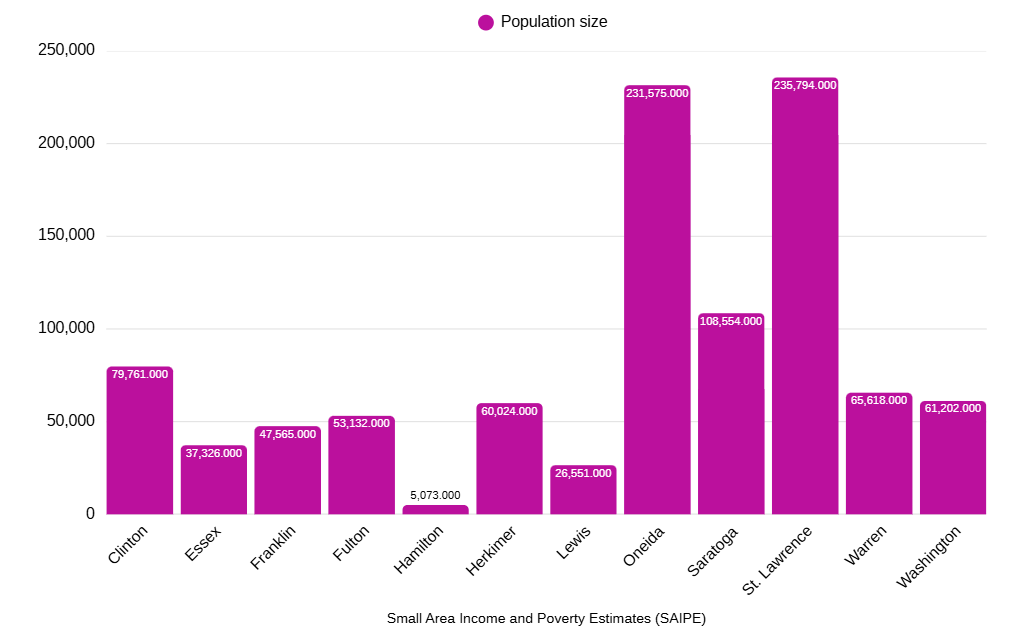
The above graph shows the population size of each of the 12 counties that are a part of the Adirondack Park.
The below graph illustrates the number of the population that is in poverty within these counties and who is participating in SNAP Benefits.
Farm Economic Data
Outlined below is the 2022 Economic Data, the line chart having green as Net Cash Farm Income of Operations Average, and red as Farm Production Expenses Averages. As you can see, the income stays below the expenses line, never intersecting in 2022.
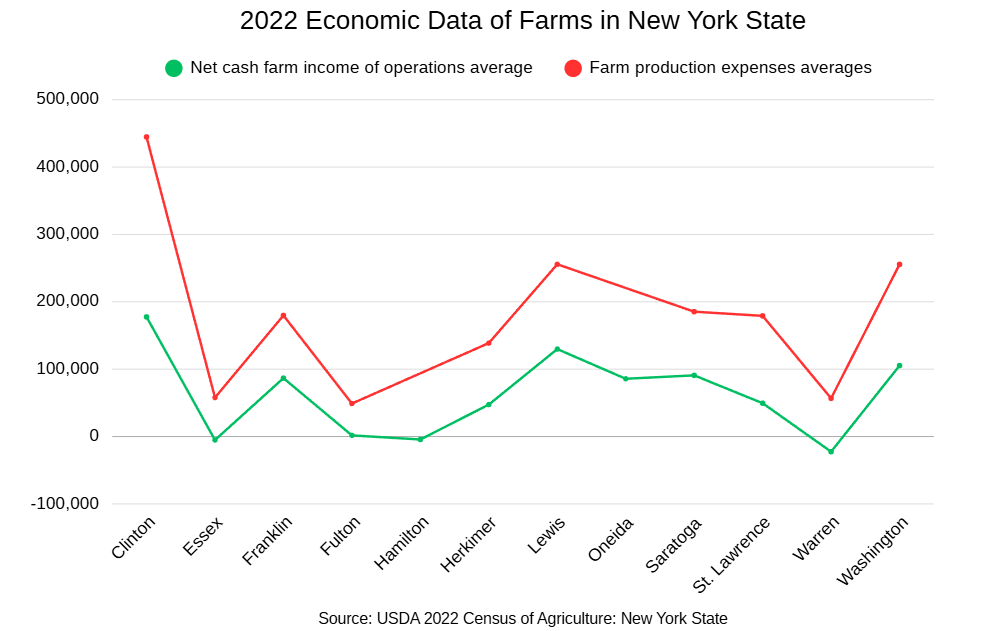
The reason for this may be that the federal government and farm-related income are not added to the net cash amount. But the disparity between the expenses and the income shows that there is a problem occuring in Adirondack farming communities.
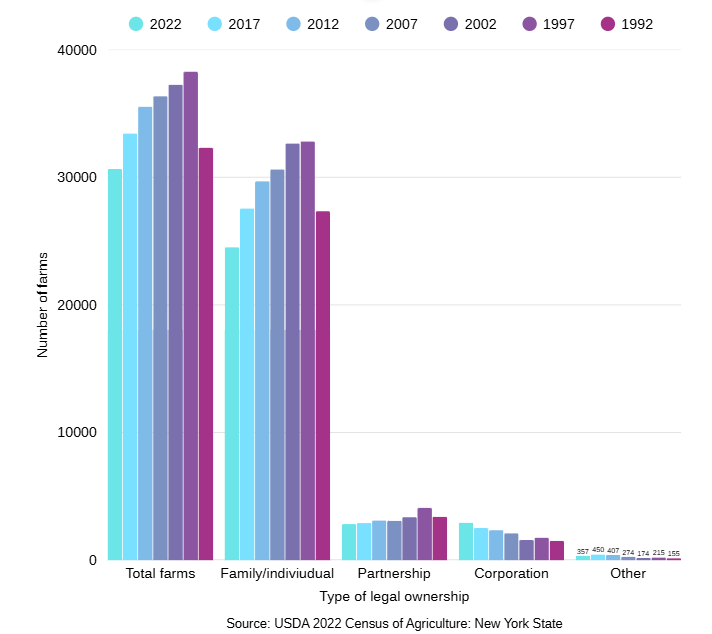
The below chart shows the type of legal ownership of farms within New York State, between the years of 2022 and 1992. The data shows that the number of individual or family owned farms in NYS is much higher than parterships, corporations, or other types of ownerships.
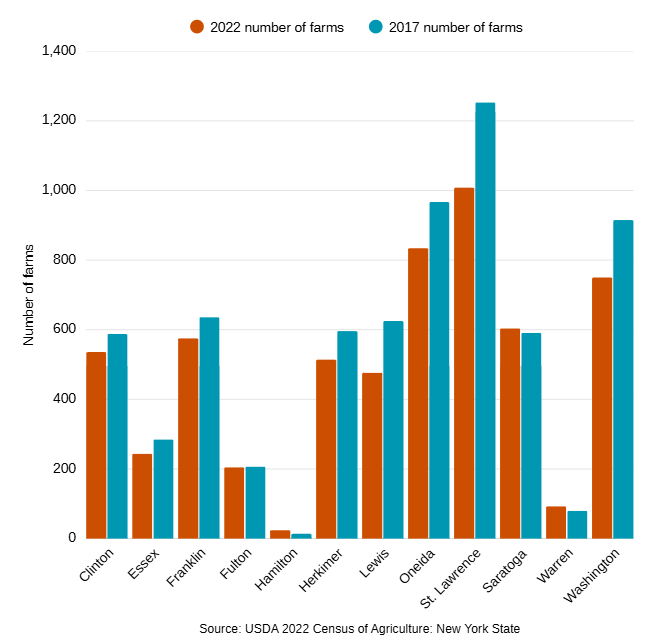
The data here illustrates the number of farms has decreased in the counties that make up the Adirondack Park between 2022 and 2017.
To the right, the map represents geographic boundaries for lands that are under the protection of NYS Agricultural District Law, administered by the New York State Department of Agriculture and Markets. The clearly defined shape of the Adirondack Park shows how little farmland is available.
Skewed data
For a lot of Adirondack communities the household income data may be skewed for a number of reasons, including but not limited to second homeownership, limited data, and unknown family size per listed household income. The park itself is a popular vacation destination, creating scarcity in the long-term housing housing supply as more profitable, short-term rental properties increase.
The Median Household income for economic data that was found for this project was based on Small Area Income and Poverty Estimates (SAIPE), and this is a short coming due to unknown family size noted above. Median Household Income does not account for household size, so survey respondants with average income but larger than average household members are not reflected for an accurate comparison to the cost of living.
The data set on Median Household Income may also be further skewed by short-term rentals and second homeownership. The Adirondack Park is a popular vacation spot there is a higher density of second home owners with larger incomes. The rise of short term rentals also leads to scarcity in the long-term housing supply, which lower income families rely on. These two factors have lead to an eclipse of lower-income property owners, which is not reflected in the median household income data.
Due to the reasons listed above, this data may not be an accurate representation of this rural area’s income level. A per capita dataset tailored to the adirondacks is not currently available for use in this evaluation. A potential future evaluation could encompass polling and survey collection to better classify poverty in this rural area, and show that the many communities within the Adirondack Park fit within a disadvantaged community classification.
Resources
- About the Adirondack Park
- Farming in the Adirondacks
- County regions
- Census data on median home income and number in poverty
- Census data for population sizes
- SNAP Benefits from the Food Research & Action Center
- USDA Census of Agriculture 2022
- USDA Cesus of Agriculture 2017
- Interactive data on Agriculture, broken down by state
- Adirondack Food System Network

Leave a comment